Related pages
A closer look at the product
Original product screenshots preserved from the current Omnilyzer website. These are reference images, not a live software demonstration.
RTK
RTK is positioned around electrical infrastructure survey work, especially low-voltage and high-voltage reporting. It combines field forms, Excel-like overview grids, GIS-backed imports, role-based access, and exportable reporting so teams can track what has been surveyed, what needs attention, and where the data should improve.
Why this page matters
RTK
Built for field and infrastructure teams that need survey reporting, geodata context, and progress visibility in one browser-based workflow.
Chapter 01
Executive summary
RTK fits organizations that need field reporting to stay tied to real infrastructure data instead of being split between paper notes, spreadsheets, and disconnected map tools.
The current application positions low-voltage and high-voltage tracking as distinct but connected workflows with clear progress visibility.
The product direction includes Excel-like tables, row-level survey history, search and filtering, status colour coding, and CSV/Excel export actions.
Survey creation is designed around actual cabinet or substation references so field records stay anchored to infrastructure objects instead of vague free-text entries.
QGIS integration is planned as a practical import/export workflow, allowing corrected field geometry to come back into the operational database as authoritative data.
Chapter 02
What the RTK product is built to handle
Low-voltage tracking
Track electrical closets and cabinets by area, town, status, and survey progress with grid-oriented visibility.
High-voltage monitoring
Manage substation-oriented reporting and quickly see which lines and stations are already surveyed versus still pending.
Survey forms for field teams
Capture survey date/time, location context, cabinet or substation links, cable-source information, and maintenance/correction notes.
GIS-backed imports
The documented product flow expects imports from Faroese GIS data sources so infrastructure references can be synchronized into the app.
QGIS export/import correction loop
GeoJSON export and re-import workflows are specified so corrected field positions can override weaker base coordinates when needed.
Role-based control and admin visibility
Admin, Planner, Surveyor, and Viewer-style access patterns are part of the product direction, alongside health, security, and audit administration.
Chapter 03
Why it is compelling as a product story
RTK translates a specialized physical-world workflow into something structured enough for daily reporting and management follow-up.
It shows Omnilyzer can work with domain-specific geodata, field reality, and role-based operations — not only generic office workflows.
The QGIS angle is particularly strong because it creates a believable bridge between field corrections, authoritative mapping, and operational tables.
This is the kind of product story that helps prospects understand Omnilyzer can build purpose-made software for hard-to-standardize environments.
Chapter 04
Product screenshots and walkthrough images
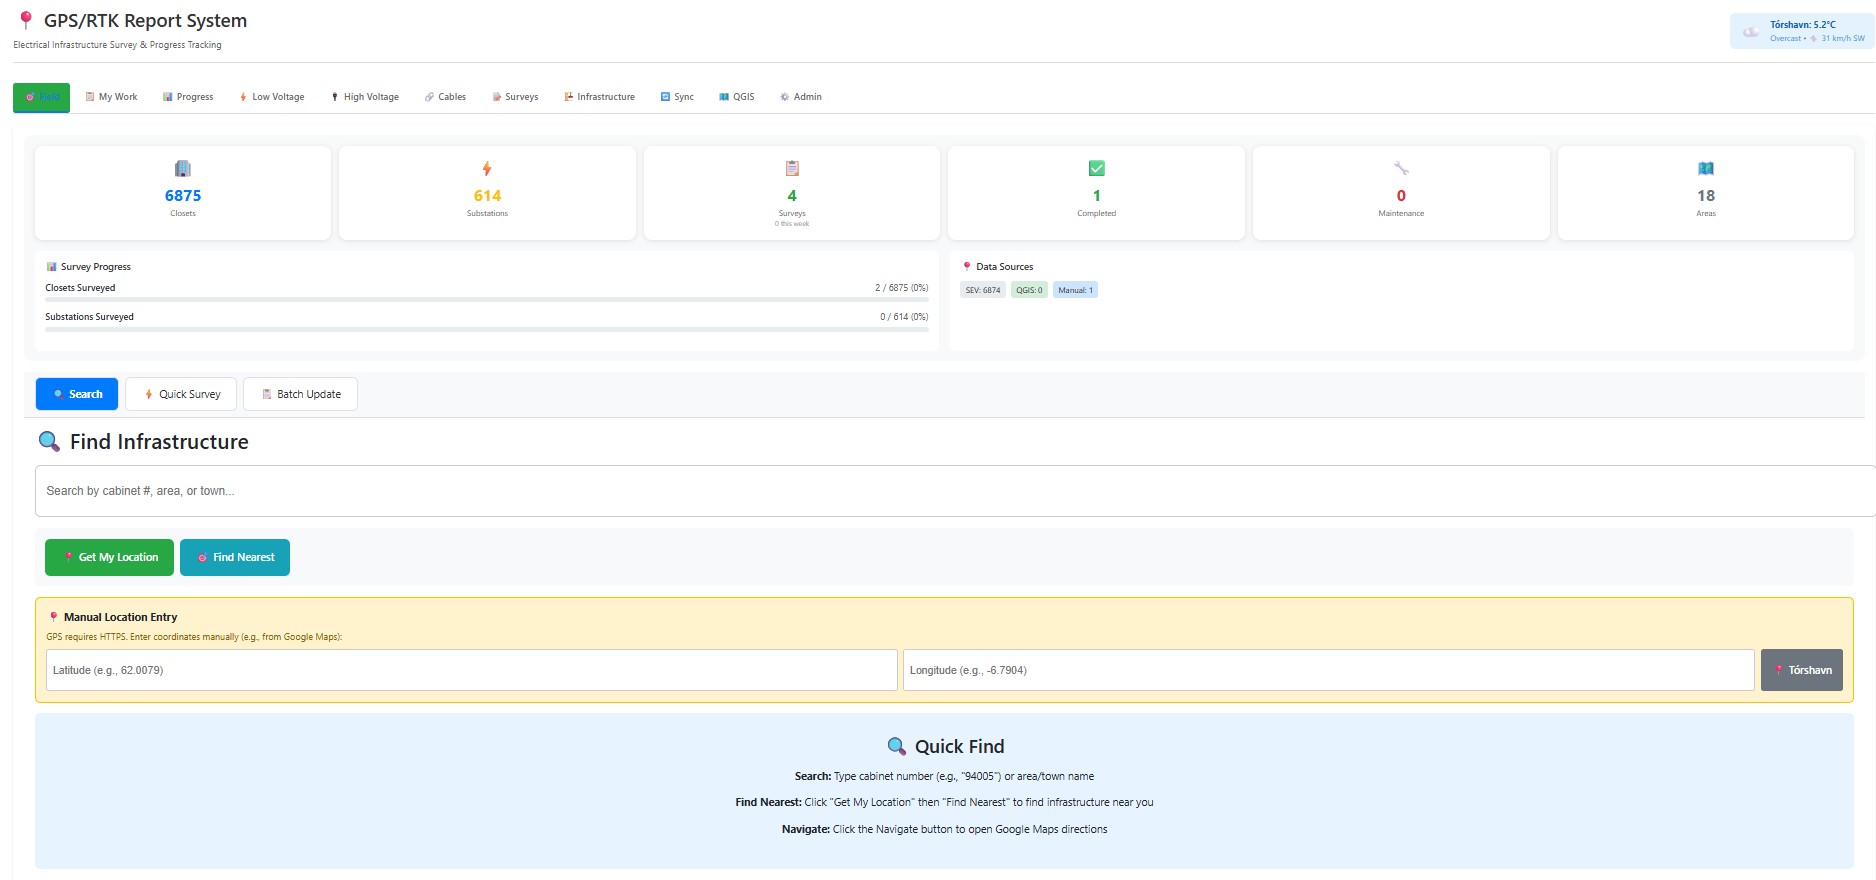
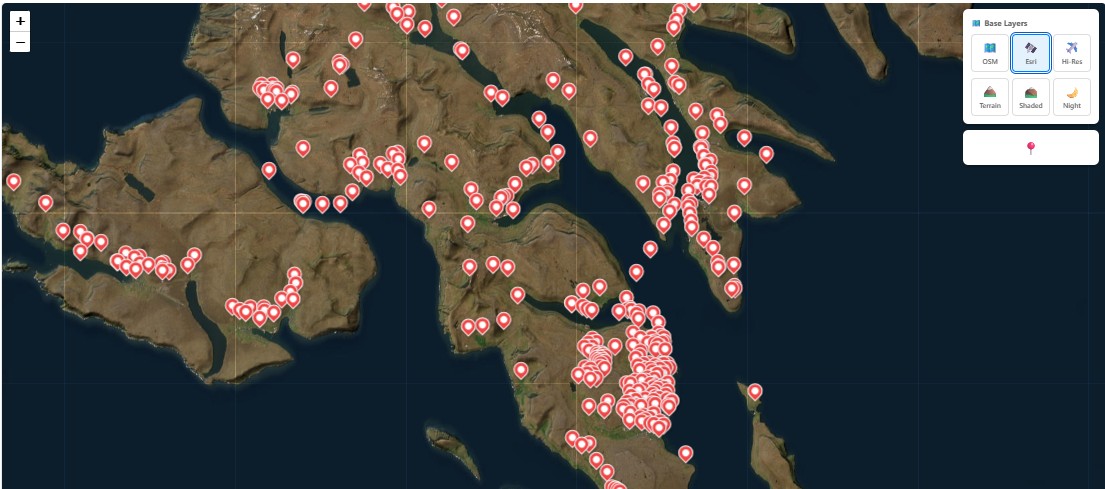
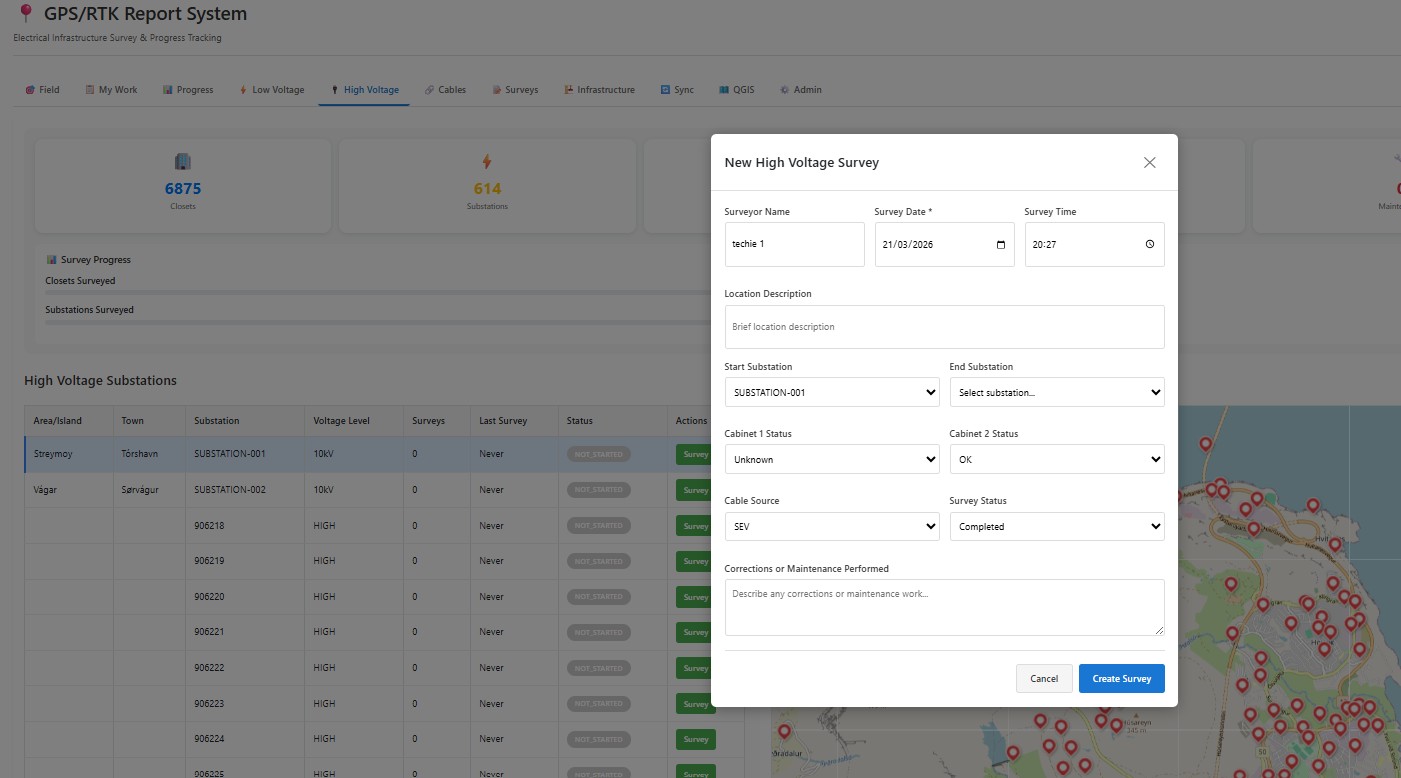
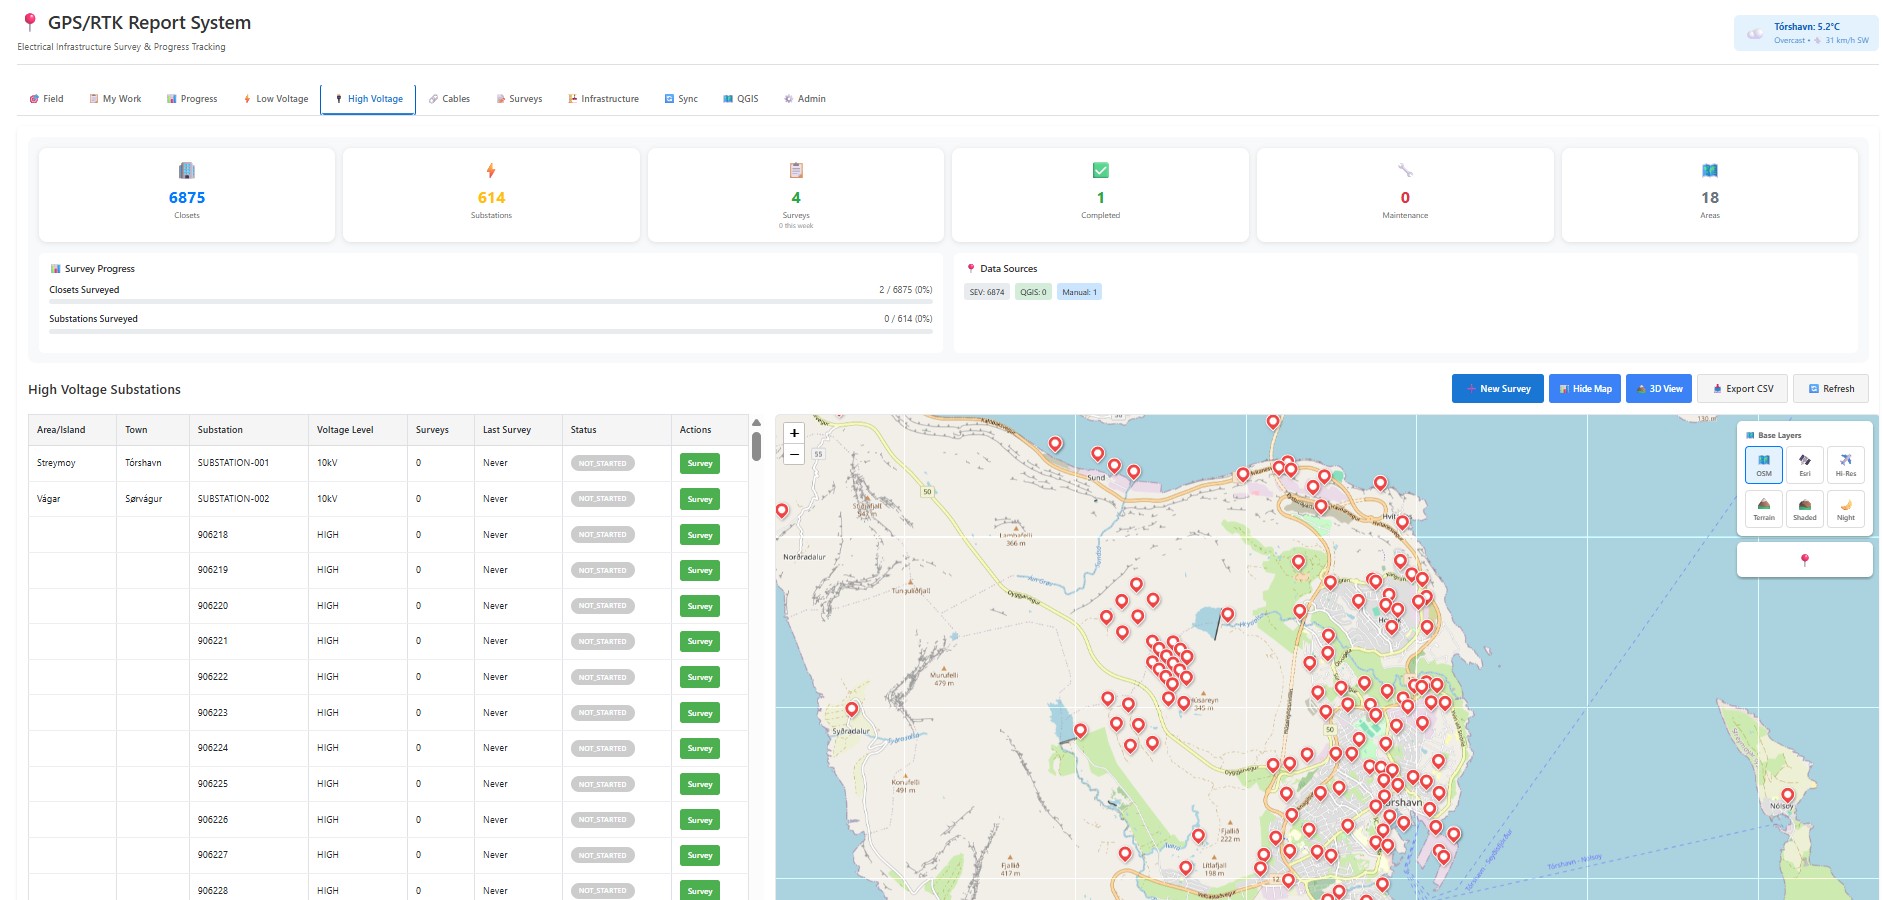
These live RTK screenshots show the dashboard, overview grid, survey capture flow, and geodata-oriented working views already available for the field-reporting product story.
RTK landing or dashboard
Live screenshot of the RTK hero/dashboard that introduces the low-voltage and high-voltage workflow.
Low-voltage overview grid
Live screenshot of the Excel-like overview grid that makes survey progress and infrastructure status obvious.
Survey form or row detail
Live screenshot of the survey capture flow showing how field teams record structured infrastructure data.
GIS or QGIS integration view
Live screenshot of the geodata-oriented view that reinforces the RTK product story around mapping and survey-linked infrastructure records.
Cookie notice